Effective Labor Rate: The Formula and the Numbers It Needs
Effective labor rate tells you what your shop actually earns per billed hour of labor, not what you wish you earned. The formula is simple: divide total labor sales by total billed labor hours for a set period. For example, if your shop sold $7,000 in labor last week and billed 45 hours, your effective labor rate is about $155.55.
You need two numbers from your management system or accounting: total labor sales and total labor hours billed. Use only the labor revenue, before taxes and fees. Do not include parts or sublet amounts. For billed hours, count every hour sold on customer invoices, including diagnostic and flat rate jobs.
The key is to use the same time frame for both numbers: a day, week, month, or rolling average. This keeps the data clean and comparable. If you track by advisor or by technician, use the same approach to see who is strong and who needs help.
Keep reading: Three Hours on a No Start: Where Diagnostic Time Actually Goes
Why the Effective Rate Sits Below the Posted Door Rate
The effective labor rate is almost always lower than your posted door rate. The reasons are built into daily operations. First, most shops discount labor in some situations, whether it is a loyalty customer, a coupon, or a multi-job repair. Discounts lower the average price per hour sold.
Second, some labor is written off when a job goes sideways. If a technician spends two hours chasing an electrical gremlin but only one hour is billed, the effective rate drops. Warranty work, comebacks, and goodwill repairs also trim actual labor earnings.
Menu-priced jobs like oil changes often post a lower hourly rate than diagnostic or heavy line repairs. When you run the numbers, every low-margin job pulls down the shop's average. Even if you keep door rates firm, these realities push effective labor rate below the sign in the waiting room.
Average Repair Order and What Counts as a Repair Order
Average repair order (ARO) is the total sales divided by the total number of repair orders written in a period. Both labor and parts go into total sales. If you write $50,000 in sales across 200 repair orders in a month, your ARO is $250.
The tricky part is defining a repair order. Most shops count every unique invoice with at least one paid line, excluding "no charge" estimates or warranty-only tickets. Some shops exclude oil changes and inspections, but that can inflate ARO and hide volume trends.
Consistency matters more than the exact rule. Choose a definition that fits your operation and stick with it. This way, you track the same kinds of work and can compare month to month. When you change management software, double-check that the system counts repair orders the same way.
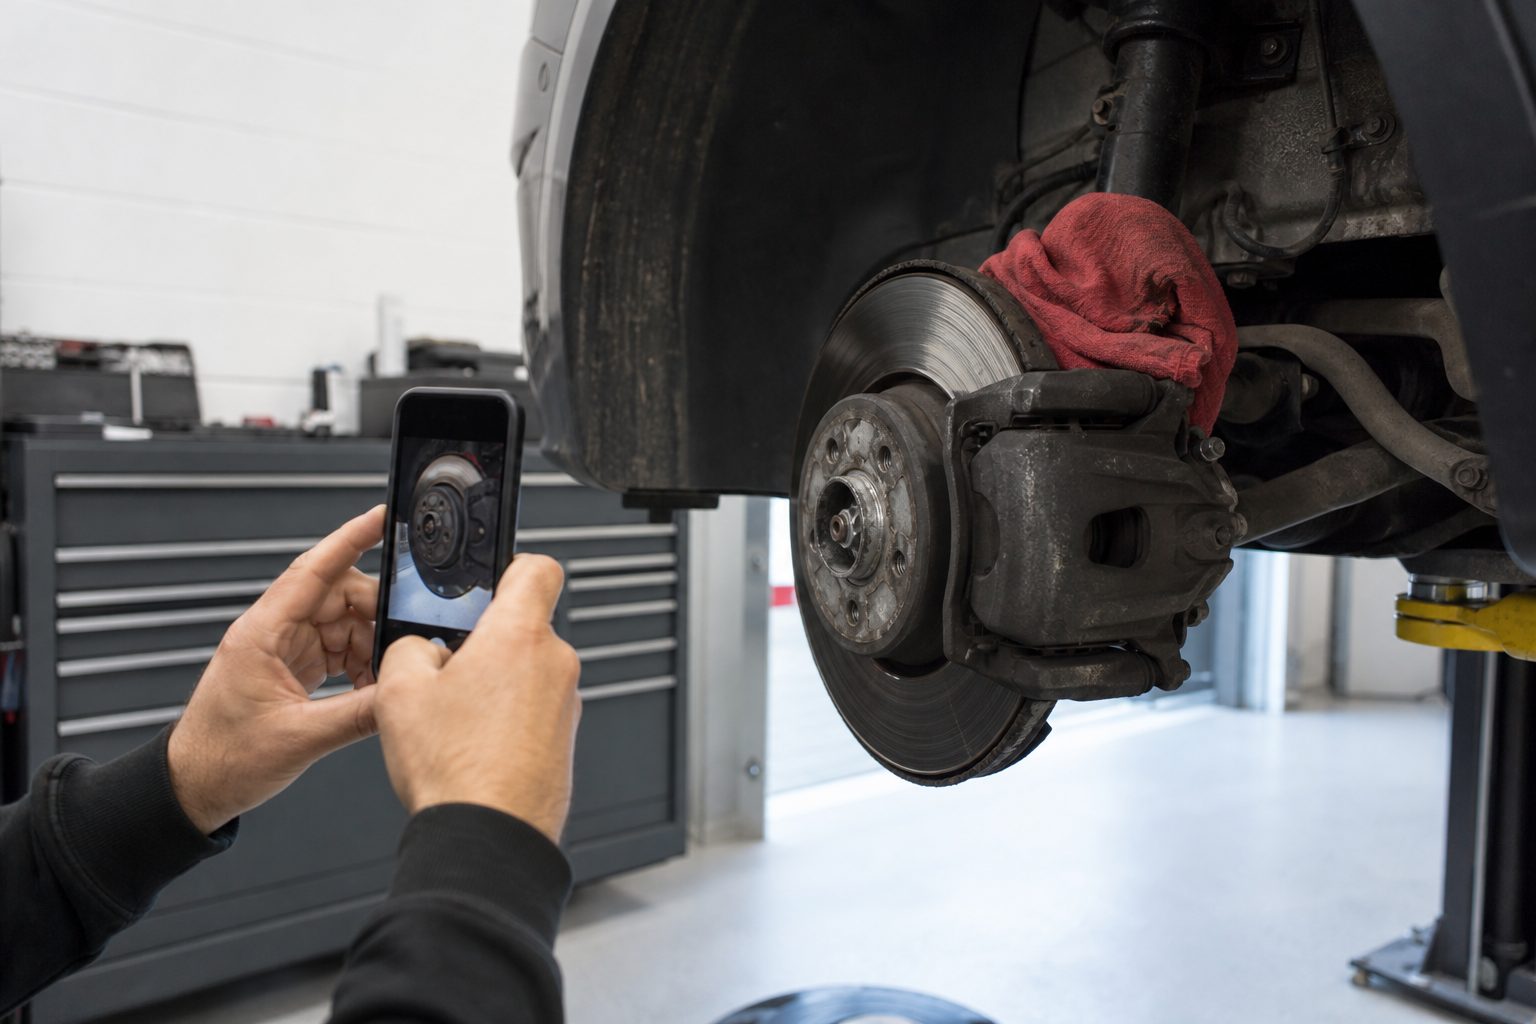
Keep reading: How to Shoot Brake, Tire, and Fluid Photos a Customer Can Read
Technician Efficiency Versus Productivity, and Why Both Matter
Technician efficiency measures billed hours versus actual hours worked. The formula is billed hours divided by clocked hours. If a tech bills 32 hours in a 40-hour week, the efficiency is 80 percent. This shows how well the technician turns time at work into revenue.
Productivity is different. Productivity is total hours a technician is at work compared to available hours in the shop. If a tech is on the clock for 32 out of 40 scheduled shop hours, productivity is also 80 percent. This number drops if techs arrive late, leave early, or have gaps between jobs.
Both numbers matter. Efficiency points to skill level, workflow, and accurate job quoting. Productivity shows if you are scheduling enough work and if technicians have enough jobs to stay busy. High efficiency with low productivity means you need more cars or better scheduling. High productivity with low efficiency means missed training or quoting issues.
How to Track and Use These Numbers
Most shop management software can report both efficiency and productivity by technician. Review these weekly to spot trends. If a tech's efficiency drops, look at comebacks or ask if parts delays are slowing jobs. If productivity is low, look at your car count or how jobs are dispatched. These numbers tell you where the bottleneck really starts.
Parts Gross Profit and How a Price Matrix Changes It
Parts gross profit is the difference between what you paid for a part and what you sold it for, divided by the sale price. For example, if you buy a water pump for $80 and sell it for $160, the gross profit is $80, or 50 percent.
To calculate overall parts gross profit, add up all parts sales for a period and subtract the total parts cost. Divide the gross profit by the sales total. This shows how much of your parts revenue stays in the business after paying your suppliers.
A price matrix can shift this number. Most shops use a sliding markup: higher markup for low-cost items, lower markup for expensive parts. For example, a $10 filter may get doubled, while a $400 fuel pump gets marked up 30 percent. The matrix balances customer price tolerance and gross profit.
If your shop uses a matrix, review the tiers each year. Supplier costs change, and so do customer expectations. If your gross profit drops, check if you are discounting too often or if the matrix is too flat for lower-cost parts.
See how InspectBay handles this for automotive repair
Hours per Repair Order and Car Count as Capacity Signals
Hours per repair order (H/RO) tracks the average billed hours for each job. Divide total billed labor hours by the number of repair orders. If you billed 120 hours over 60 repair orders, your H/RO is 2.0.
This number shows job mix and upsell performance. Higher hours per RO usually mean technicians are finding and selling more needed work per car. If your hours per RO dip, you may be seeing too many quick services or missing inspection sales.
Car count is the total number of repair orders, usually tracked daily or weekly. This measures shop volume. A healthy mix is important: too few cars and the bays sit empty, too many and quality suffers.
Watching both numbers together helps you spot changes in business mix. If car count rises but hours per RO falls, you may be doing more oil changes and less high-ticket work. If both slide, it is time to look at marketing and customer retention.
Working Backward From the Bay Hours You Need to Break Even
Break-even analysis helps you set clear goals for billed hours. Start with fixed costs: rent, utilities, insurance, salaries, and so on. Add variable costs like parts and supplies. Add your target profit above expenses.
Divide total needed revenue by your effective labor rate to find the hours you must bill. For example, if your monthly fixed and variable costs plus profit target total $50,000, and your effective labor rate is $125, you need to bill 400 hours that month.
Then compare this goal to your current hours billed per repair order and car count. Can your current business mix actually deliver enough hours? If not, you may need to raise your effective labor rate, improve technician efficiency, or increase sales per car.
This exercise also shows where the bottleneck sits: too few cars, too little work per car, too many discounts, or too much unbilled time. Adjust your sales and staffing plans to close the gap.
A Reporting Rhythm: What to Read Daily, Weekly and Monthly
Numbers only help if you read them. Build a reporting habit that matches the pace of your operation. Daily, review car count, total sales, and technician hours clocked and billed. This shows if you are on track or need to adjust the schedule.
Weekly, read your effective labor rate, average repair order, technician efficiency, productivity, and parts gross profit. Track variance from targets, and review comebacks or discounts that hit margins. Meet with your team to discuss the numbers and set small goals.
Monthly, step back and look at trends: sales per car, hours per repair order, car count, and total profit. Compare to past months and your break-even needs. Adjust your marketing, staffing, and pricing plans as needed.
For all these metrics, the quality of your data depends on accurate inspections and clear repair orders. Digital vehicle inspection tools that attach technician photos, grade issue severity, and send customers a one-link approval make this process easier. With reliable data at every step, the numbers you calculate will reflect the real performance of your shop and help you run a more profitable operation.